Spoiler: Purple Air Map using the LRAPA Conversion on a short-time interval
For those of us living in the San Francisco Bay Area, October 2017 was the beginning of a "new era" in terms of wildfires. In 2018, Northern California experienced the deadliest wildfire and in 2020, we are in the middle of the largest combined wildfire in California history. Jake Hess, Cal Fire Unit Chief for Santa Clara, says we're now living in an era of "mega-fires."
For those of living Alameda, we're quiet lucky because the risk of death or damage by these fires is probably non-existent, but it doesn't mean we are free of potential health risks; air pollution. This especially applies to children and teens, seniors, and/or those with lung disease. A John Hopkins study found that children exposed to outdoor coarse particulate matter (PM10-2.5), were more likely to develop asthma and need emergency room or hospital treatment for it.
For those who have children or even pets that are treated like children, it's not realistic to stay indoors all the time, especially when there are windows in the morning, late afternoon, and evening when the air quality is moderate enough for some outdoor exposure. But to choose the right time, we need to know which Air Quality Map, Monitor, or App is best to make that decision.
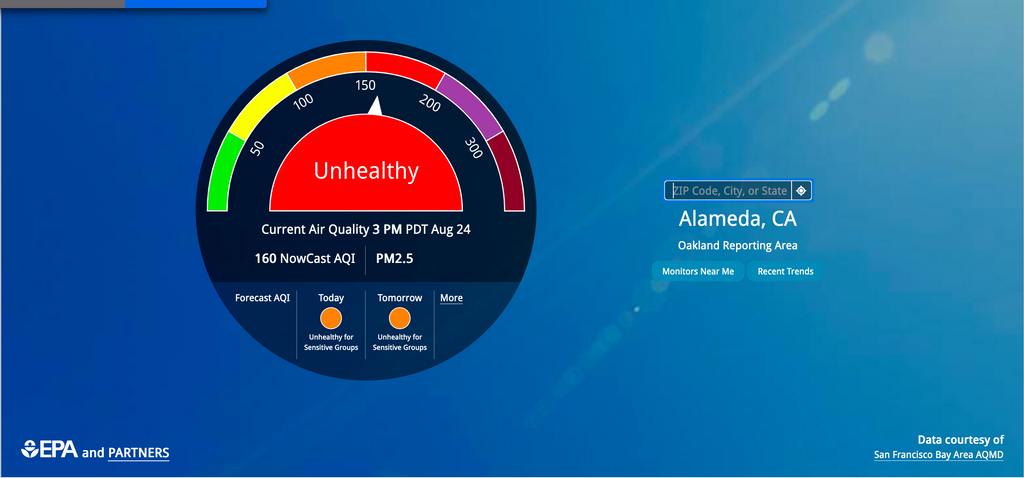
On August 24, 2020 at 12:32pm, here are the US AQI readings for my Central Alameda location from what I believe are the most popular sources:
AirNow.gov App & Website: 153 (unhealthy). Side note, ten minutes ago it was showing reporting 98 (moderate). That's a huge jump in just ten minutes, I'll tell you why in a bit.
Airvisuals: 181 (unhealthy)
Purple Air Map (closest sensor LRAPA conversion showing real time): 154 (unhealthy)
While the AirNow and Purple Air are showing very similar readings, that's actually more coincidental than anything else.
As I "spoiled" at the beginning of this post, I choose Purple Air's Website using the LRAPA conversion. Here's my reasoning.
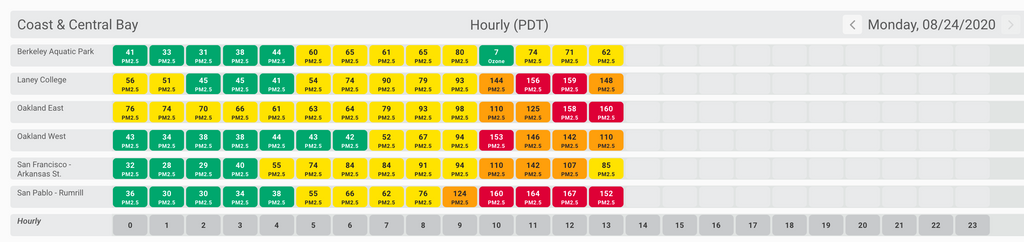
AirNow is definitely using the most accurate equipment at their stations. From what I've read, these are $20K stations. The problem is how they report. AirNow, for Alameda specifically, uses information from the Bay Area Air Quality Management District (BAAQMD). BAAQMD feeds Airnow with an hourly average from two hours before, choosing the highest number among the West Oakland, Laney College, and East Oakland stations.
Hence, that's the reason why at 11:59am, Air Now can be reporting an AQI of 98 and in the next minute an AQI of 153. Not only that, but 98 and 153 are readings from 9am and 10am, respectively, which is two hours before. This obviously isn't very helpful if you step out the door to let you children play at 11:59am, thinking that it should be okay for the time being. In reality, you're making decisions using somewhat outdated information.
Also, surprisingly, the AQI can vastly differ from mile to mile. For example, using the BAAQMD readings, the AQI 7am average was 90 at Laney College and 52 in West Oakland, which is about a five minute drive. That's a 73% increase between the two sites. Using the Purple Air map, my closest Purple Air sensor shows an AQI of 147, while Ballena Bay is showing an AQI of 63. That's a huge difference for a location only 1-1.5 miles away.
While Airnow has the most accurate information in term of technical readings, but relatively speaking, it's outdated and not very useful if you're not right next to the stations.
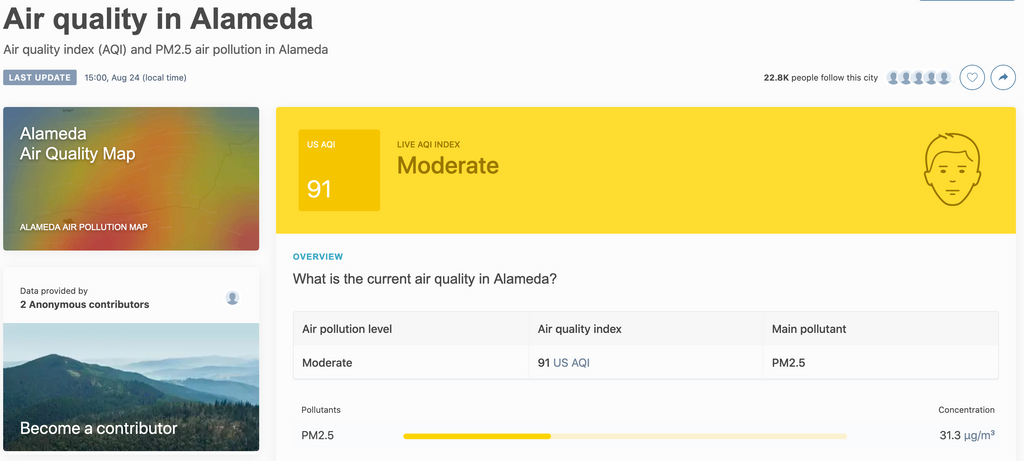
Moving on to AirVisual, the app combines official government and Purple Air as sources. Between 2-3pm, AirVisual is reporting an AQI of 144 for all of Alameda. Unfortunately, they don't discuss exactly how they get that number, though they do cite the sources. From what I can tell, it is an hourly average from the previous hour, but from how many and which monitors is unknown. Once again, not very helpful in making decisions.
For example, right now at 2:59pm, Airvisuals last updated "Alameda" at 2pm, while I can go to the Purple Air Map and see that the real time data shows an AQI 66 with the LRAPA conversion for the closest station to me, Sherman St. Using the AirVisuals data, I'm still stuck in my house, using the Purple Air data, I can confidently leave the house.
Why can I be confident? Because the EPA, South Coast Air Quality Management Department (SCAQMD), Berkeley Labs, Lane Regional Protection Agency (LRAPA), are among some of the agencies studying the accuracy of Purple Air Sensors. While almost all agencies say that Purple Air over reports PM2.5 levels, which is what is most important during the wildfires, according to Berkeley Labs, "the relative changes correlated well with both the regulatory and professional monitors." The South Coast AQMD also found this correlation for PM1 and PM2.5, though the correlation is not very good at PM10.
Berkeley Labs found that if they multiplied the reading by 0.48, it gave similar readings as their institutional equipment. Not surprisingly, the 0.48 multiple is very close to the LRAPA conversion given on the Purple Air website. From what I've read, this conversion is most useful when the pollutant is basically from wildfires.
With multiple agencies validating the Purple Air Sensors correlation with regulatory and professional monitors, which is mostly corrected using the LRAPA conversion, it's hard to argue against using the Purple Air Map on Alameda. On Alameda, there are 11 outdoor sensors feeding data covering most of the island, though one or two sensor seems to be an outlier at times. Unless you're staring right at Laney College, these sensors are much more applicable for those on Alameda.
Finally, the Purple Air map gives you an option of seeing real time data, so you're not basing decision from an hourly average one or two hours ago.
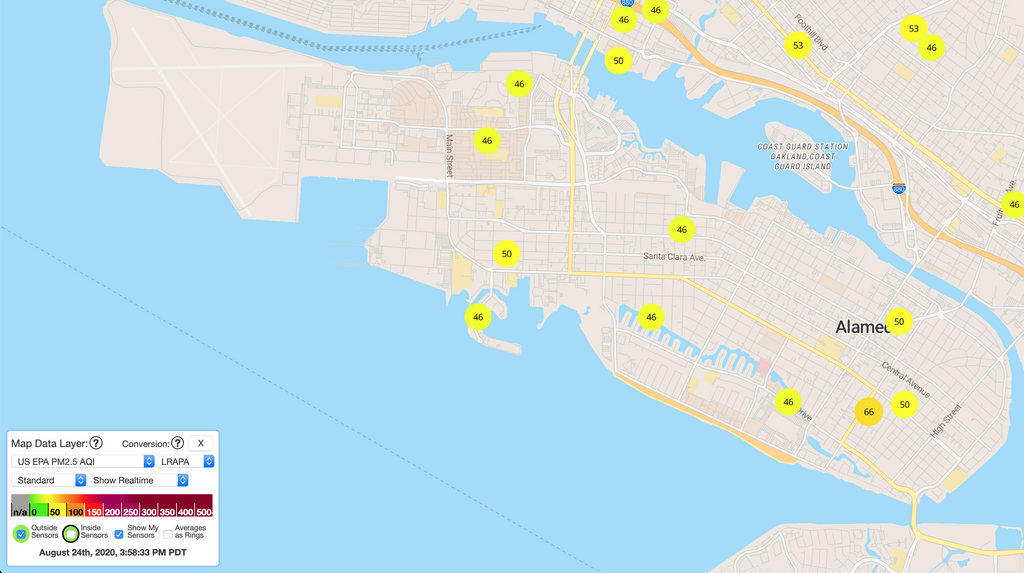
At 3:30pm, AirNow is reporting and AQI of 159, based off a reading two hours ago at the East Oakland station, Airvisuals an AQI of 91, last updated 30 minutes ago and based off of some unknown modeled data from stations that may or may not be near me, and Purple Air is showing me an AQI of 50 from the closest sensor to my location, the "Sherman St Station," with the LRAPA conversion applied.
Knowing that the Purple Air sensors have been well studied for correlation accuracy against regulatory and professional monitors, using the LRAPA conversion, and looking at the sensors closest to me, I can confidently take a step out of my house while those looking at AirNow or even AirVisual are waiting for better readings.